How to use try-on data in range planning and buying
Tried-versus-bought ratios, requested sizes and store-level try-ons can sharpen size curves, allocation and re-orders, and protect full-price sell-through.
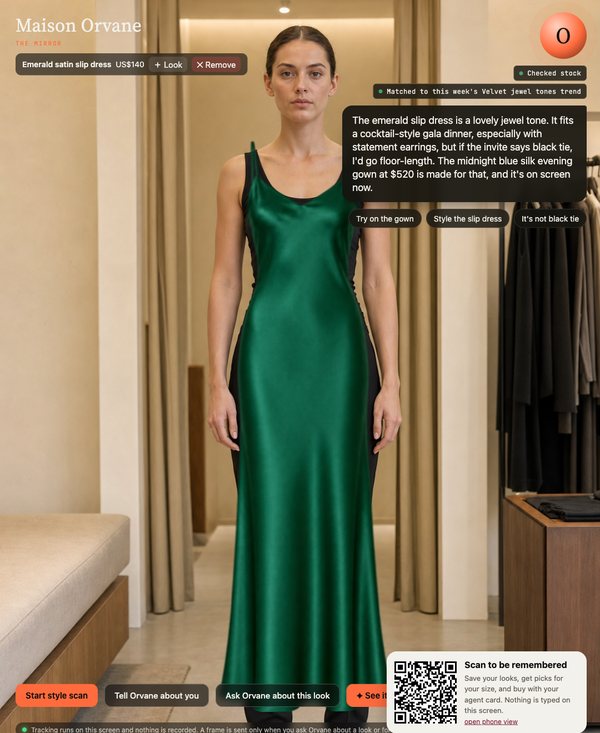
Try-on data tells a merchandiser what shoppers were interested in before they decided, which sales data never shows. Used well, the ratio of pieces tried to pieces bought, the sizes shoppers asked for and the differences between stores can sharpen size curves, store allocation and re-orders. The pay-off is more of the range sold at full price and fewer markdowns at the end of the season.
This guide is for heads of merchandising, planning and buying at fashion and jewellery brands who are starting to see try-on and question data from their stores, and want to know what to do with it.
What counts as try-on data?
When shoppers try pieces on a screen, or ask a stylist about them, a store can record a set of events it never saw before. The useful ones are:
- Tried: a piece was put on, live or in a photo.
- Kept: the shopper saved the look or sent it to their phone.
- Bought: the piece was sold in that store, matched by style and day.
- Asked about: a question named the piece, its fit, its price or an occasion.
- Size requested: the shopper asked for a size, whether or not it was in stock.
- Not found: the shopper asked for something the store did not have.
None of this needs personal data. Counts by style, size, store and week are enough for every decision in this guide.
What does the tried-versus-bought ratio tell you?
The simplest measure is conversion from try-on to purchase for each style. On its own the number means little. Compared across styles in the same category, and read alongside how often each was tried, it sorts the range into four groups.
| Pattern | What it usually means | What to look at |
|---|---|---|
| Tried often, bought often | A winner | Depth, size availability, re-order lead time |
| Tried often, bought rarely | Interest without conviction | Fit, price, styling, missing sizes |
| Tried rarely, bought often | Sells itself, but is hard to find | Placement, display, whether staff know it |
| Tried rarely, bought rarely | Weak appeal | Candidate to exit or move |
The second row is the one sales data hides. A silk midi dress tried 180 times in a month and bought nine times looks like a slow seller in the sales report. In the try-on data it looks like a strong idea with a specific problem. The questions shoppers asked about it often say which problem: "does it come in a longer length?", "is there anything like this under $400?", "do you have it in a 14?"
Two cautions. Compare styles within a category and a store, because a counter screen for earrings and a full-length mirror for dresses will produce very different numbers. And set a minimum count before you act, so that a handful of tries in a quiet week doesn't move a buy.
How can try-on data improve size curves?
Size curves are usually built from sales history, and sales history is distorted by stock-outs. A 2023 study of 217 stores of a sportswear chain found that about 51.7% of unmet demand for an out-of-stock size moved to the adjacent sizes, and about 28.1% became lost sales. When a size sells out early, part of its demand shows up as sales of its neighbours and part vanishes. A curve built from those sales repeats last season's mistakes.
Size requests recorded at the screen are closer to true demand, because they include the sizes that were not there. Comparing requested sizes with sold sizes, by store, shows where the curve is off. A London store may need a deeper run of small sizes than a Dubai store, or a jewellery counter in New York may hear more requests for longer chain lengths than the one in Milan.
Size gaps are costly. In an AlixPartners and FDRA survey of more than 1,000 US footwear shoppers, published in April 2026, 65% said they had abandoned a purchase because their size was out of stock.
How should try-on data change allocation by store?
Allocation decides how a fixed buy is spread across stores. Try-on data adds a local demand signal that arrives before sales do. A practical approach:
- Index tries per style by store, adjusted for how many shoppers used the screen that week.
- Group stores with similar patterns into clusters, rather than allocating store by store from scratch.
- Shift the next drop toward stores where a style is tried and asked about more than its sales suggest, especially where sizes ran out.
- Move stock in season from stores where a style is tried rarely to stores where it is tried often.
Better allocation has a measurable value. In a controlled field experiment at Zara, a model-based allocation process increased sales and reduced transfers between stores, compared with the manual process it replaced. McKinsey notes that many apparel retailers have looked to replace manual store allocation with analytics models, and lists establishing size curves by category as a typical use case.
How does it help with re-orders and open-to-buy?
The earlier a buyer knows which styles are working, the more of the season is left to sell them. Try-on data gives an early read in the first days after a drop, before sales have built up.
McKinsey recommends brands scale up test-and-repeat, so they can back best-sellers quickly, and keep a larger share of open-to-buy for short-term, demand-led decisions. Try-on data makes both easier to justify:
- Re-order with confidence when a style is tried often, converts well and is running out of key sizes.
- Re-order a variant when shoppers repeatedly ask for a colour, length or metal you don't carry.
- Hold back when early sales look strong but tries are concentrated in one store.
What is the link to full-price sell-through and markdowns?
Markdowns are mostly the cost of decisions made too late: stock in the wrong store, the wrong sizes or a style nobody fixed. McKinsey estimates that applying integrated digital solutions to merchandising could bring an 8 percent rise in full-price sell-through, along with faster time to market. Try-on data supports that in three ways.
- It finds fixable slow-sellers early. A style that is tried often and bought rarely may need re-styling, a different display or a size rebalance, not a discount.
- It moves stock before it is marked down. Transfers to stores where a style is tried more often can clear it at full price.
- It informs markdown depth. A style shoppers still try every day needs a smaller reduction than one nobody touches.
A weekly rhythm that works
- Monday: review last week's tries, keeps, sales and unanswered questions by store and category.
- Flag styles with high tries and low conversion, and size requests that went unmet.
- Decide on transfers, re-orders and display changes, with an owner for each.
- Feed repeated requests for things you don't stock into the next buying or design meeting.
- Check the following week whether the change moved full-price sales.
What to watch out for
- Novelty. In the first weeks after screens go in, shoppers try things for fun. Let the numbers settle before setting benchmarks.
- Placement. A piece featured on the screen's home view will be tried more. Compare like with like.
- Privacy. Merchandising decisions need aggregates, not individuals. In Ateliq, tracking runs on the screen and nothing is recorded; profiles exist only for shoppers who opt in.
Ateliq's analyst reports what was tried, asked for and bought, by store and by week, which is the raw material for everything above. The decisions stay with your planners and buyers.
Sources
- Li, Lu, Lu and Huang: Estimating the stockout-based demand spillover effect in a fashion retail setting, M&SOM, 2023
- AlixPartners and FDRA: Spring 2026 Footwear Survey
- Caro and Gallien: Inventory management of a fast-fashion retail network, MIT Sloan
- McKinsey: Geek meets chic, four actions to jump-start advanced analytics in apparel, 2018
- McKinsey: Great merchandising never goes out of fashion, March 2023
Questions people ask
What is the tried-versus-bought ratio?
It is how often a style is bought compared with how often it is tried on, by store and week. A style tried often but bought rarely usually has a fixable problem, such as fit, price, styling or missing sizes.
Why are size curves built from sales history often wrong?
Because stock-outs distort them. When a size sells out, part of its demand moves to neighbouring sizes and part is lost, so sales under-state the missing size. Size requests recorded in store include sizes that were not there.
How does try-on data reduce markdowns?
It gives an early read on which styles are working, so teams can re-style, rebalance sizes or move stock between stores while a style can still sell at full price. It also helps set markdown depth for styles shoppers still try.