How to measure an in-store AI pilot
Metrics, control store design, pilot length and common pitfalls for measuring an in-store AI pilot in fashion or jewellery retail, from engagement to conversion and ATV.
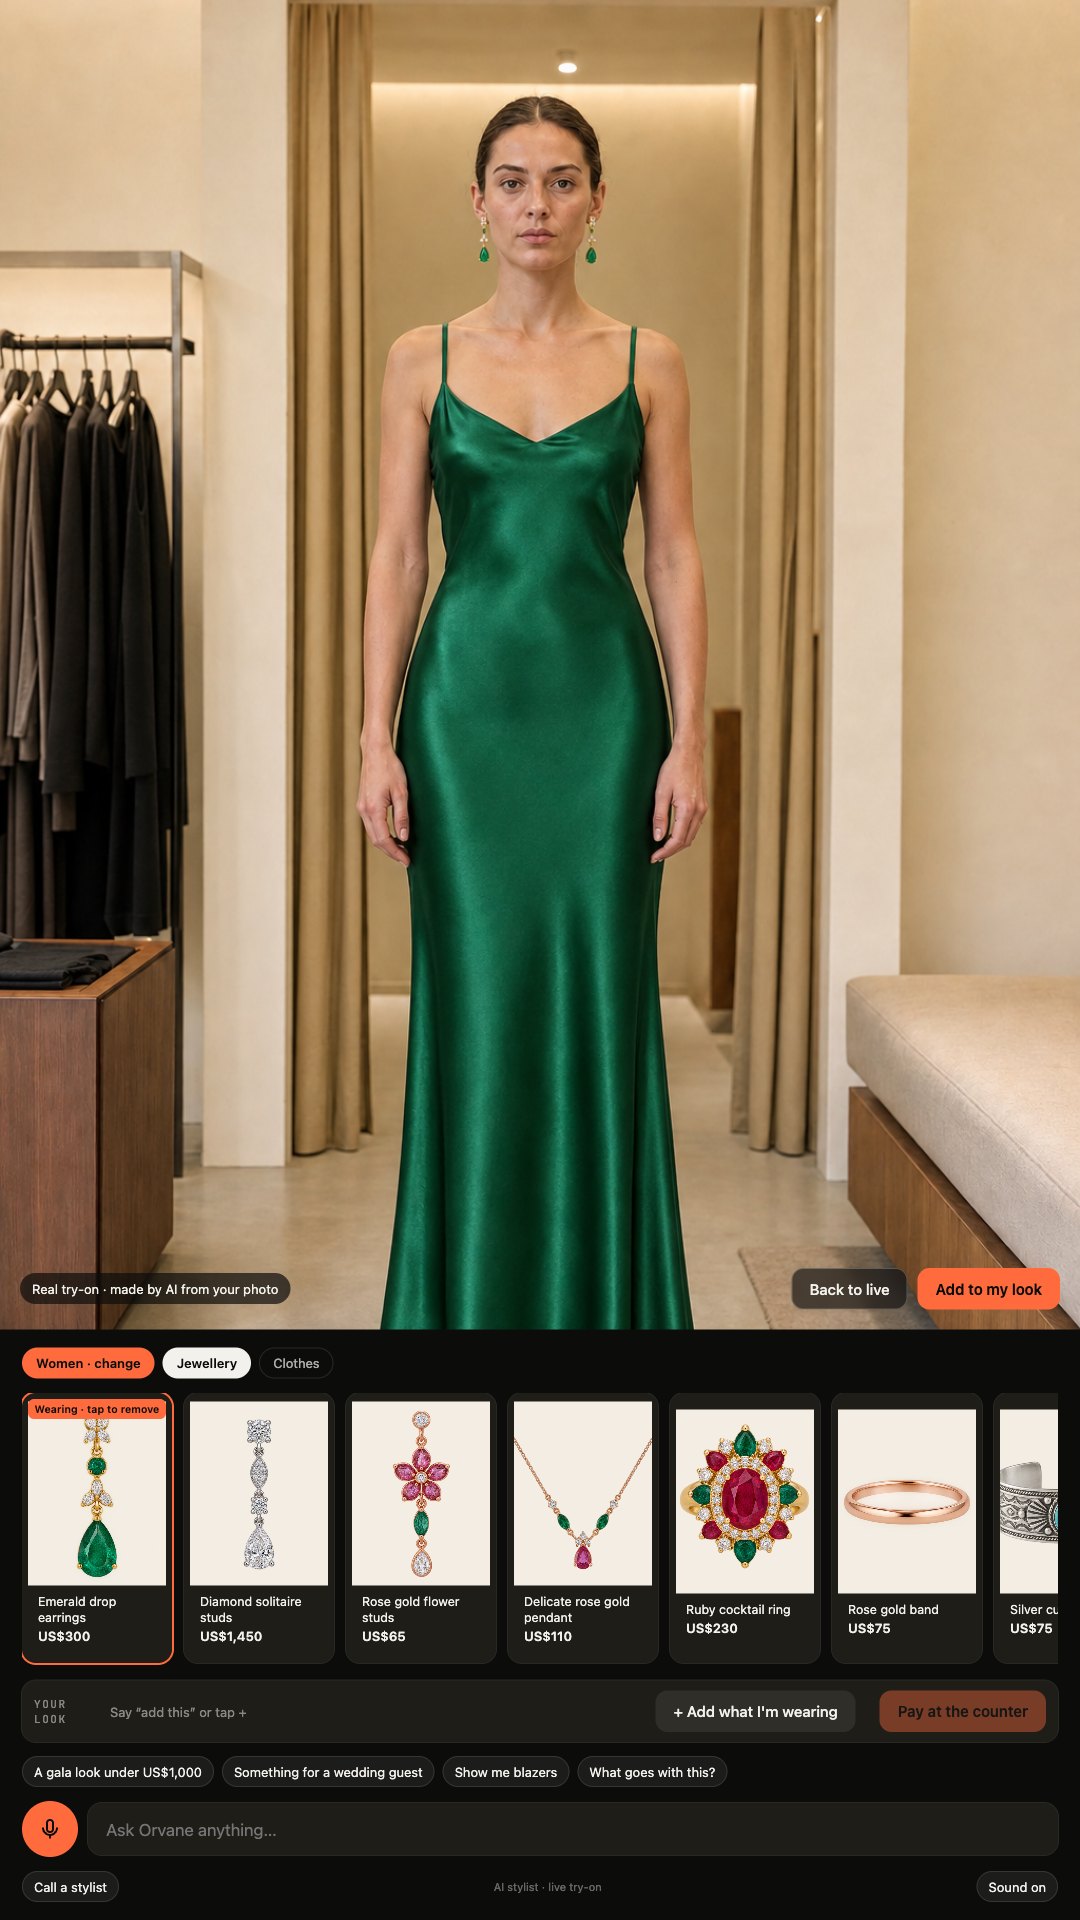
Measure an in-store AI pilot in three layers: whether shoppers use it, whether it changes what happens in the visit, and whether it moves sales. The commercial numbers (conversion, average transaction value and units per transaction) should be compared against matched control stores over the same weeks, with a baseline period before launch, over at least two to three months. Usage figures on their own tell you a screen is popular, not that it pays for itself.
This guide sets out the metrics, how to choose control stores, how long to run the pilot, and the mistakes that most often make pilot results impossible to trust.
What question is the pilot answering?
Write the question down before anything is installed. "Does an in-store stylist increase conversion and average transaction value at the jewellery counter, without lowering full-price sell-through?" is a question a pilot can answer. "Let's see how shoppers like it" is not.
Eric Anderson and Duncan Simester, writing in Harvard Business Review, argue that most companies will get more value from basic business experiments than from a complex analytics programme. The method is "test and learn": take one action with one group of customers, a different action or none with a control group, and compare the results. An in-store pilot is exactly that, with stores as the groups.
Agree the decision rule at the start too: what result would lead you to roll out, extend or stop. Deciding after the numbers arrive invites everyone to find the reading they prefer.
Which metrics matter in an in-store AI pilot?
Group the metrics into three layers. Each layer explains the next.
| Metric | How to define it | What it tells you |
|---|---|---|
| Engagement share | Shoppers who interact with the screen, divided by store traffic | Whether the screen is placed and introduced well |
| Try-ons per day | Pieces tried on screen, per store per trading day | Depth of use, and which pieces draw interest |
| QR sends | Looks sent to a shopper's phone, as a share of sessions | Intent strong enough to take the look away |
| Opt-in rate | Sessions where the shopper agrees to be remembered | Trust, and the size of your future first-party audience |
| Stylist calls | Requests for a staff member from the screen, and time to respond | Whether the screen hands shoppers to staff, and whether staff come |
| Asked for, not stocked | Requests the stylist could not answer from stock, by theme | Unmet demand: colours, cuts, occasions or prices missing from the range |
| Conversion | Transactions divided by traffic, pilot against control | The main commercial effect |
| ATV and UPT | Average transaction value and units per transaction | Whether shoppers buy more, or more valuable, pieces |
| Full-price sell-through | Share of tried pieces sold before markdown | Whether the effect holds without discounting |
| Return visits | Opted-in shoppers who come back within 30, 60 or 90 days | Whether the visit builds a relationship |
| Follow-up sales | Sales to opted-in shoppers within a set window after a follow-up message | Revenue that happens after the visit, outside the store's tills on the day |
Two of these deserve more attention than they usually get.
Asked for, not stocked is often the most valuable output of a pilot, because no till receipt records it. Out-of-stocks are expensive across retail: IHL Group's 2025 research puts the global cost of inventory distortion at $1.73 trillion a year, of which $1.157 trillion is lost to out-of-stocks when customers leave empty-handed, as summarised by Board. A pilot that shows what shoppers wanted and could not find is worth reading even if conversion barely moves.
Follow-up sales need a definition set in advance: which messages count, which window (say 14 or 30 days), and which channels, store or online. Without one, every later purchase gets claimed by the pilot.
How should you choose control stores?
A control store is one that is as similar as possible to a pilot store, but without the new technology. The comparison is not "pilot store this year against last year". It is "how much did the pilot store change, compared with how much the control stores changed over the same weeks". That second measure removes the effect of weather, the economy and marketing campaigns that hit every store at once.
This matters because the background is moving. Sensormatic Solutions reported that US in-store traffic on Black Friday 2025 was down 2.1% compared with 2024 (Sensormatic). A pilot judged against last year alone could look like a failure in a falling market, or a success in a rising one.
Match control stores on:
- Sales, traffic and conversion over the previous 12 weeks, including their trend, not only the level.
- Format and size: a flagship on Bond Street or Fifth Avenue is not comparable to a mall store.
- Customer mix, including the share of tourist and international spend.
- Assortment and price architecture.
- Staffing levels and the experience of the team.
Use two or three control stores for each pilot store if you can, and keep them far enough away that shoppers are unlikely to visit both. For a chain of 10 to 200 stores, three to five pilot stores with matched controls is a sensible starting point. Fewer than that, and one unusual store can decide the result.
How long should the pilot run?
- Baseline: collect at least four to eight weeks of the same metrics in pilot and control stores before launch.
- Settling in: treat the first two weeks after install as learning time for staff and leave them out of the main read.
- Measurement: run at least eight to twelve weeks after that, long enough to include ordinary weeks, a payday cycle and at least one promotional period.
- Follow-up window: keep measuring return visits and follow-up sales for 30 to 90 days after the main period ends.
Fine jewellery needs longer than fashion. Transactions are fewer and larger, so one bridal sale can swing a week's ATV. More weeks, and more stores, smooth that out.
What are the common pitfalls?
- Judging by usage alone. High engagement with no change in conversion or ATV is entertainment, not a business case.
- Piloting only in the flagship. The best store, with the best staff and the most tourists, rarely predicts the rest of the estate.
- The novelty effect. Shoppers and staff try anything new. Look at whether usage holds in weeks six to twelve, not only in week one.
- A motivated pilot team. Staff who know they are being watched often sell harder. That is real, but it won't scale unless the behaviour does.
- Staff who see the screen as competition. If advisors think it takes their commission, usage collapses. Make sure sales started on the screen still count for the advisor who closes them. Training matters too: in the BoF and McKinsey State of Fashion 2026 report, 47% of US consumer goods and retail employees said training was the most important factor for adopting generative AI, according to FashionUnited.
- Different stock or promotions. If the pilot stores receive a new collection or a promotion that the controls don't, the result is about the collection, not the technology.
- Staff counted as traffic. If people counters include employees, conversion is understated, and unevenly so between stores.
- Privacy treated as an afterthought. Brilliant Earth's annual report notes that virtual try-on features may collect biometric identifiers, which some US states regulate. Settle consent, data retention and what the camera records with your legal team before launch, in every market you pilot in.
Which shoppers does it help most?
Split the results, not only the total. A Journal of Marketing study by Tan, Chandukala and Reddy found that the sales effect of augmented reality was stronger for less popular brands, more expensive products and customers new to the category. Your pilot may show something similar: a modest average effect, and a much larger one for first-time buyers, higher price points or particular categories such as earrings. That tells you where to roll out first.
What should the pilot report look like?
Keep it to one page per store, every week: the three layers of metrics, pilot against control, plus a short list of what shoppers asked for and could not find. Ateliq's analyst reports what was tried, asked for and bought, by store and by week, and each week's insight feeds the next week's trend board for the city. Whatever system you use, the weekly report should lead to a decision about stock, staffing or the range, not just a chart.
At the end, return to the question and the decision rule you wrote down at the start. If the pilot answered it, act on the answer.
Sources
- Harvard Business Review: A Step-by-Step Guide to Smart Business Experiments (Anderson and Simester)
- Board: The $1.73 trillion wake-up call (IHL Group 2025 study)
- Sensormatic Solutions: Black Friday 2025 recap
- FashionUnited: The State of Fashion 2026 (BoF and McKinsey)
- Brilliant Earth Group: Form 10-K for 2025
- Kellogg School of Management: Augmented reality in retail and its impact on sales (Journal of Marketing)
Questions people ask
What metrics should an in-store AI pilot track?
Track three layers: usage (engagement share, try-ons per day, QR sends, opt-in rate), behaviour (stylist calls, requests the store could not answer from stock) and commercial results (conversion, ATV, UPT, full-price sell-through, return visits and follow-up sales).
How do you choose control stores for a retail pilot?
Match each pilot store with two or three stores of similar sales, traffic, conversion trend, format, customer mix and assortment, far enough away that shoppers won't visit both. Compare how much the pilot changed against how much the controls changed over the same weeks.
How long should an in-store AI pilot run?
Collect four to eight weeks of baseline data, leave out the first two weeks after install, then measure for at least eight to twelve weeks. Fine jewellery usually needs longer than fashion because transactions are fewer and larger.